Start a project

Data platforms & business intelligence Turn fragmented data into decisions teams can trust.

Connect operational data, define reliable metrics and give teams a clear view of performance. We build practical data platforms and BI experiences around the decisions your organisation needs to make.

Enterprise delivery · Senior specialists · UK & Türkiye
Data platforms & business intelligence by Dika Design
02 · When teams call us

Signs it is time to change the system.

Two reports, two answers

Teams argue about whose number is right instead of what to do about it.

Month-end reporting by hand

Analysts spend days exporting, pasting and checking spreadsheets.

Data trapped inside tools

Each system has its own reports, and nothing shows the whole picture.

Dashboards nobody opens

Screens full of charts that do not match any decision people make.

Problems found too late

Stock, cash or service issues surface weeks after they started.

No one owns the numbers

Definitions change quietly, and trust in reporting fades.

03 · Our approach

Data capabilities from integration to insight

  1. One definition of the metricShared data models reduce conflicting reports and make performance conversations more productive.
  2. Designed for the decisionEvery dashboard begins with the action, audience and operating rhythm it needs to support.
  3. Maintainable data flowsPipelines, ownership and monitoring are documented so the platform remains dependable as systems change.
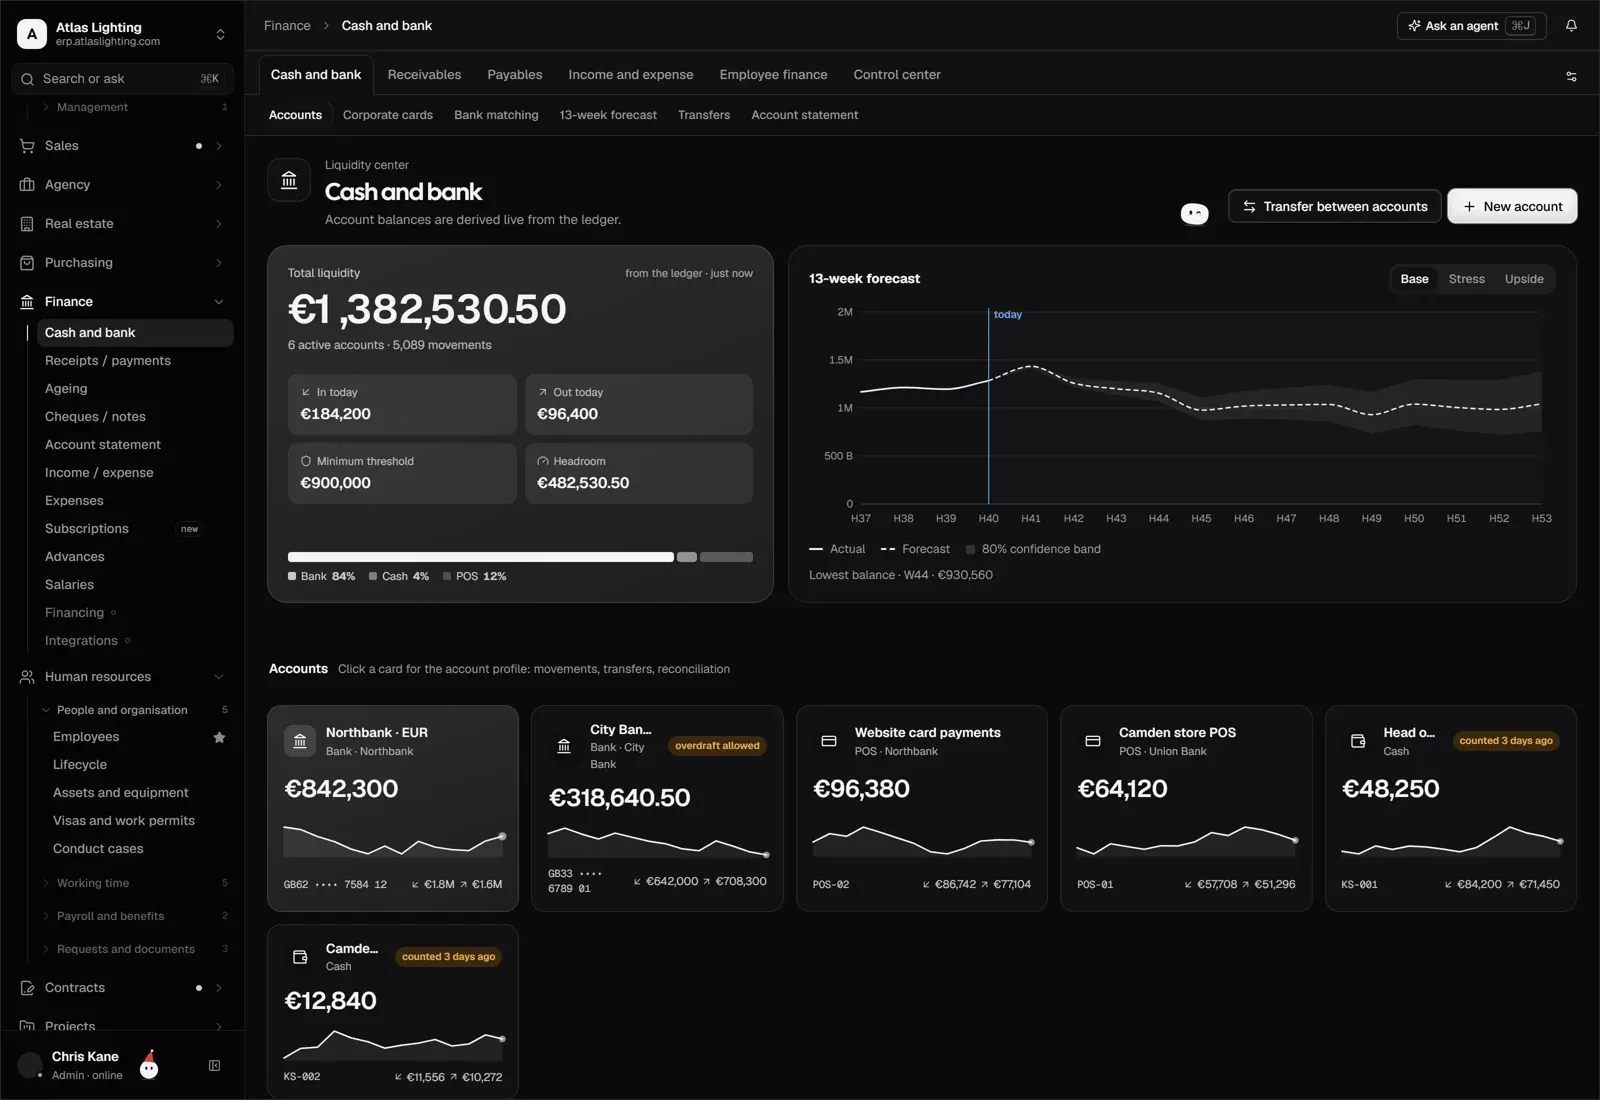
Cash position and a 13-week forecast in Dika Ops
Built the same way · cash and forecasts in Dika Ops
04 · Capabilities

Sixteen capabilities. One accountable team.

Everything we design, build and run in Data & BI, delivered by the same senior team.

  • 01

    Data source integration

    Connections to applications, databases, files and APIs, refreshed on a schedule.

  • 02

    Data models and definitions

    Business entities and metrics described once and used everywhere.

  • 03

    ETL and ELT pipelines

    Repeatable jobs that extract, clean and load data in the right order.

  • 04

    Data warehouses

    A central store for history and analysis when your scale needs one.

  • 05

    Operational dashboards

    Live views for the people who run daily work, not only for management.

  • 06

    Executive reporting

    A short set of trusted numbers for leadership, with the detail one click away.

  • 07

    Self-service analytics

    Prepared datasets that teams can explore without writing queries.

  • 08

    Automated reporting

    Scheduled reports delivered to the right people without manual exports.

  • 09

    Data quality controls

    Checks for missing, late or inconsistent data before it reaches a report.

  • 10

    Metric governance

    Owners, definitions and change history for the numbers that matter.

  • 11

    Event and product analytics

    Usage data from your product and website, modelled for decisions.

  • 12

    Alerts and anomaly workflows

    Notifications when a metric crosses a threshold, with a clear next step.

  • 13

    CRM and commerce analytics

    Pipeline, customer and order data joined into one view of revenue.

  • 14

    Access and permissions

    People see the data their role allows, down to row level where needed.

  • 15

    Pipeline monitoring

    Visibility of every job, with failures reported before users notice.

  • 16

    Embedded analytics

    Charts and reports placed inside your applications and portals.

05 · How an engagement runs

Five steps, visible at every stage.

  1. 01Decision mappingThe decisions, audiences and rhythms the platform must support.
  2. 02Source auditWhere the data lives, how good it is and who owns it.
  3. 03Model and pipelinesShared definitions and repeatable, monitored data flows.
  4. 04Dashboards and alertsViews designed around roles, with alerts that lead to action.
  5. 05Adoption and ownershipTraining, documentation and named owners for each metric.
06 · What you receive

Deliverables you keep, not just a launch.

Every engagement ends with assets your organisation owns and can run without us.

Plan the first phase
  • Metric dictionary

    Every key number defined, with its owner, logic and source.

  • Data model

    A documented model of customers, products, orders and finance.

  • Monitored pipelines

    Scheduled data flows with quality checks and failure alerts.

  • Role-based dashboards

    Views for leadership, managers and operational teams.

  • Scheduled reports and alerts

    Recurring reports and threshold notifications, delivered automatically.

  • Runbook and ownership

    How the platform runs, how to change it and who decides.

07 · Who it is for

Built for organisations like yours.

Finance and leadership

Teams that need trusted numbers for planning, cash and performance.

Operations and supply chain

People managing stock, production, delivery and service levels.

Sales and commerce teams

Teams tracking pipeline, customers, orders and margins.

Product teams

Teams that need usage data to decide what to build next.

Start from decisions, not charts

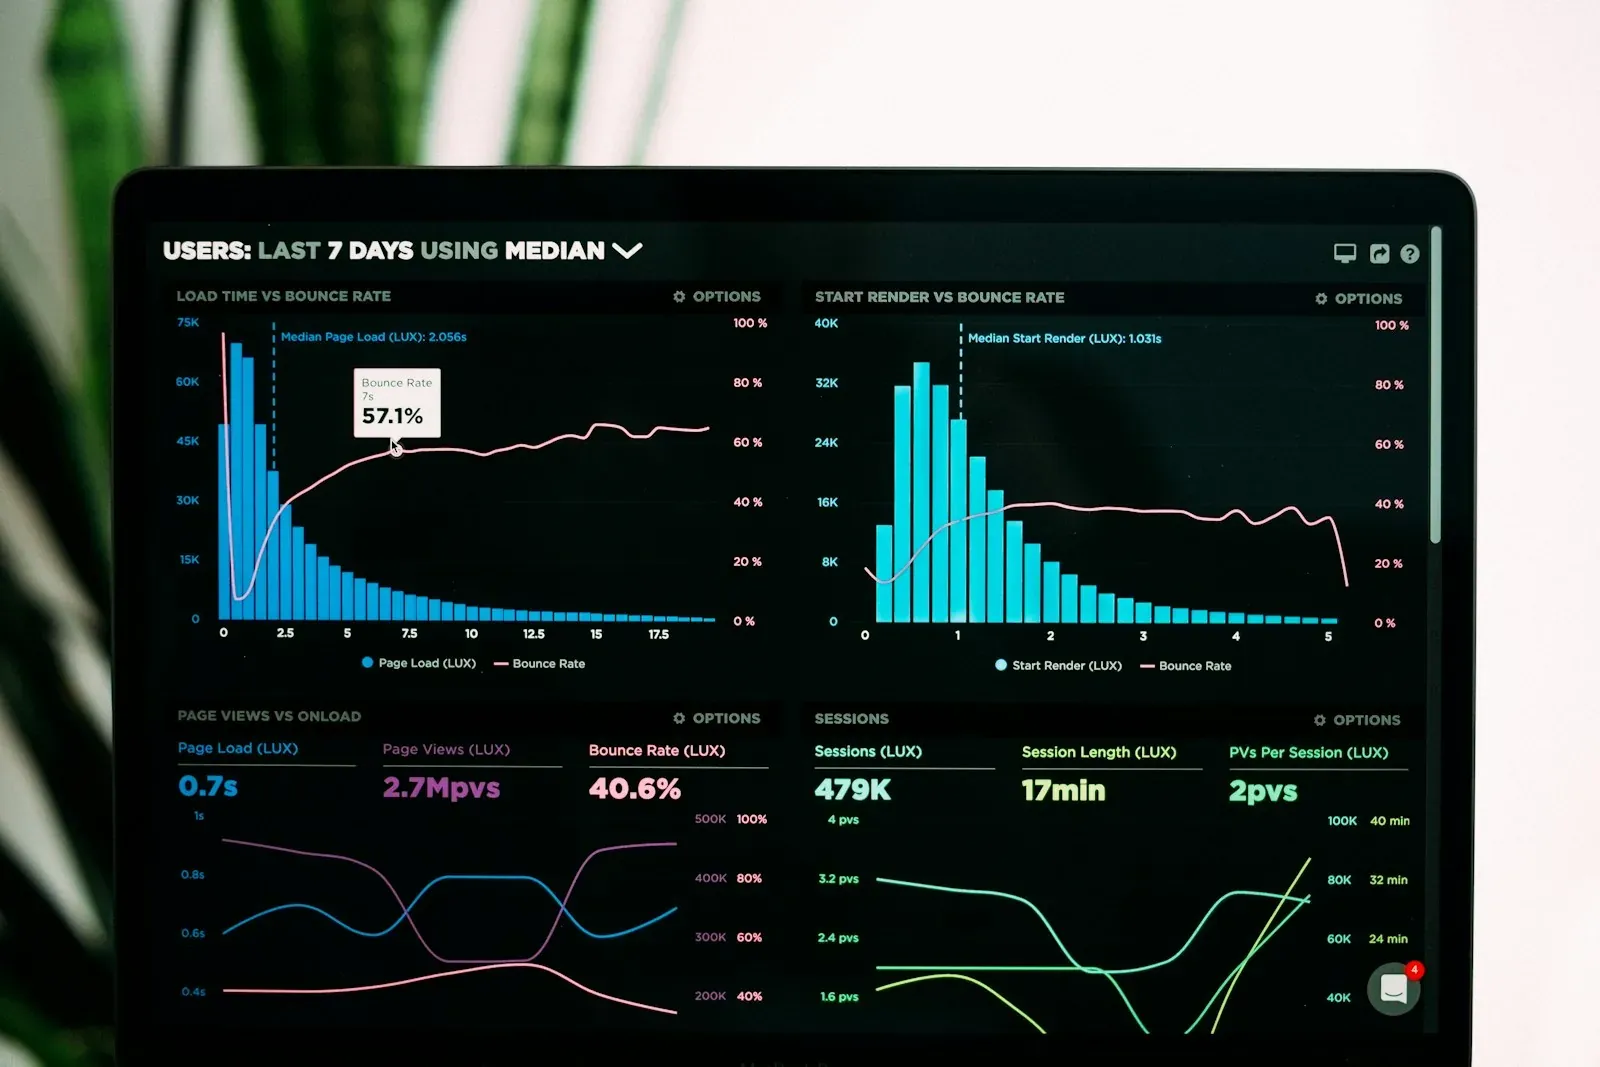
A useful dashboard answers a question someone actually has to decide on. We begin by listing those decisions, who makes them and how often, then design the data and views that support them.

This keeps the platform small and trusted, instead of a large set of charts that nobody opens.

Do you need a data warehouse?

Not always. Smaller organisations can report well from a clean operational database with a few prepared views. A warehouse becomes worthwhile when you combine many sources, keep long history, or serve many teams with different questions.

We recommend the simplest architecture that will still hold up as data and teams grow.

One definition per metric

Conflicting numbers usually come from different definitions, not wrong data. We agree how each key metric is calculated, from which source and who owns it, and we keep that definition in one place that every report uses.

From dashboard to action

Insight only helps if it reaches the people who can act. Alerts, scheduled reports and figures embedded in operational screens close the gap between noticing a problem and doing something about it.


FAQ

Data & BI, answered.

Clear answers before discovery, scoping and delivery begin.

Ask a different question
Can you connect data from our existing tools?

Yes. We can integrate APIs, databases, files and business platforms, then model the information into a consistent reporting layer.

Do we need a data warehouse?

Not always. The right architecture depends on source volume, refresh needs, history, governance and the number of teams consuming the data.

Which dashboard tools do you support?

We work with established BI platforms and can also build custom or embedded dashboards when the workflow requires a tailored experience.

How do you prevent conflicting numbers?

We define metric ownership, calculation logic, source lineage and validation rules before dashboards are treated as authoritative.

Can reports be automated?

Yes. Scheduled reporting, alerts, threshold notifications and workflow triggers can reduce recurring manual reporting work.

Can the platform run in our cloud environment?

Yes. We can design the data and application layers for customer-controlled cloud or server infrastructure.

Do you maintain data pipelines after launch?

Yes. Monitoring, source changes, quality issues and new reporting requirements can be handled through ongoing support.

How quickly will we see the first dashboards?

We start with the most important decision and deliver a first trusted view early, then extend the model and pipelines in stages.

Can you clean up our existing data?

Yes. Data quality work, de-duplication and fixing source processes are often part of the first phase.

Who maintains the definitions after launch?

Each metric gets a named owner on your side. We document the process for changing definitions and can support it on an ongoing basis.

Give every team a clearer view of the business.

Show us the decisions that are slow, disputed or based on manual reporting. We will map the data path required to improve them.

  • Business questions drive the architecture
  • Shared metric definitions
  • Dashboards connected to action